



|
Exploring the unknown components of diversity
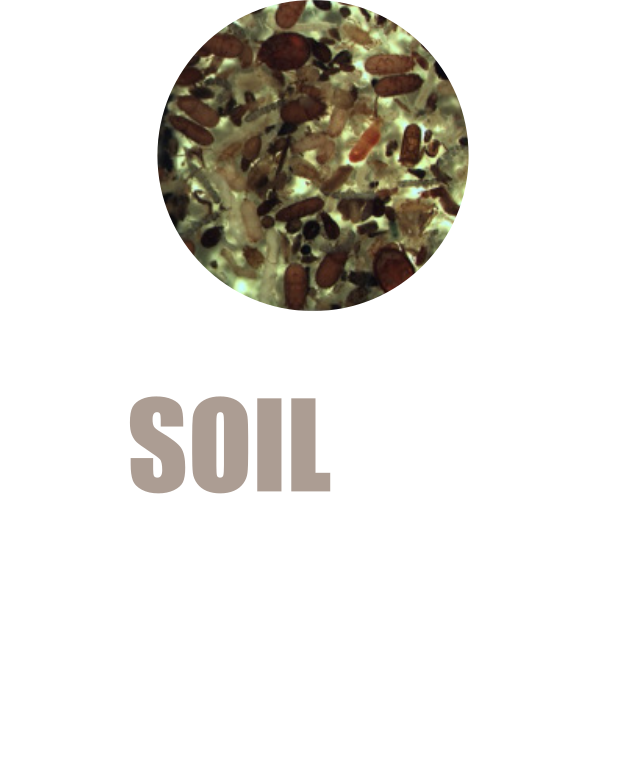
The SOIL100 subproject focuses on the 'hidden' below-ground diversity of insects and other arthropods in the soil, which harbour many poorly known components. |
|
Linking site-based and lineage-based analyses
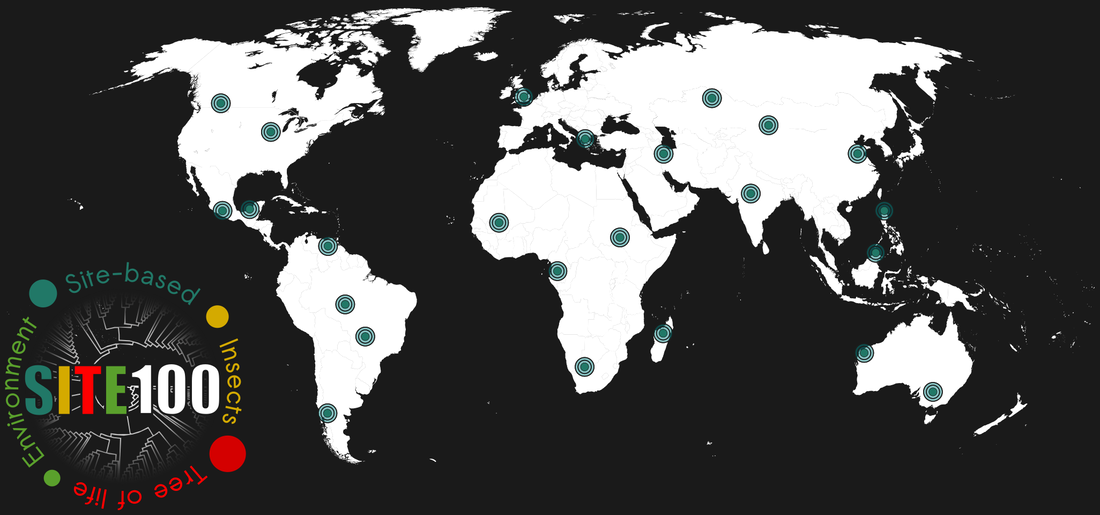
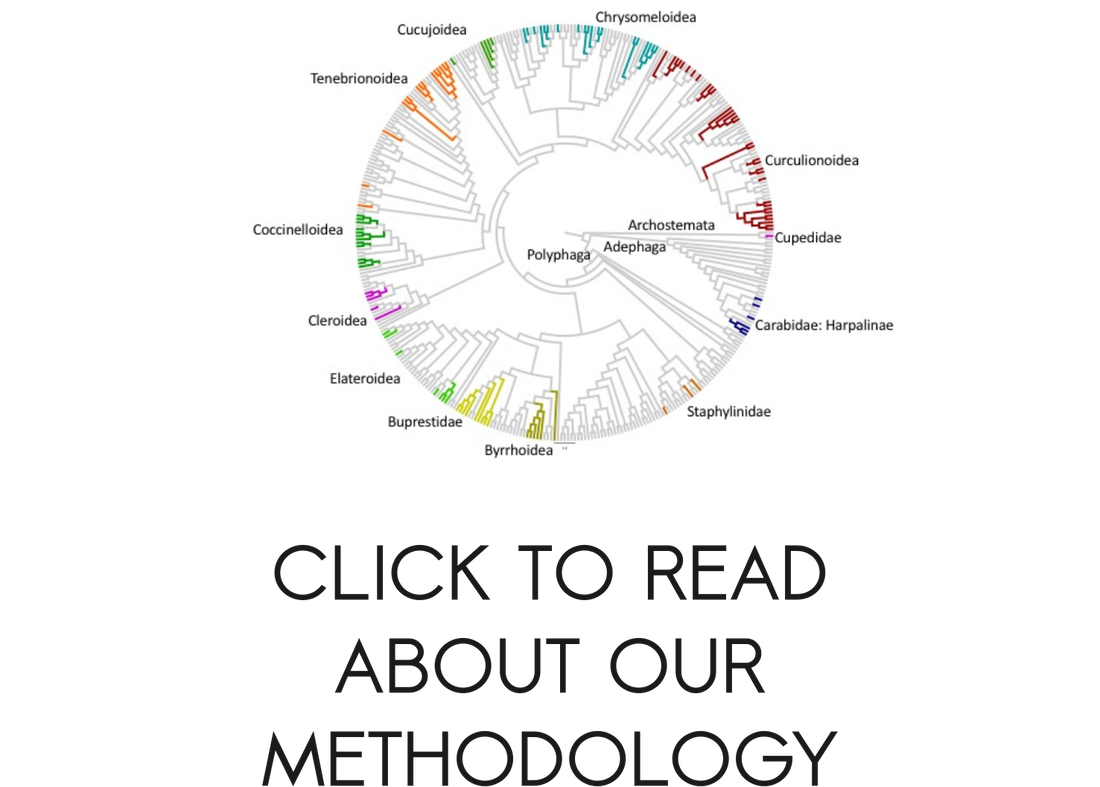
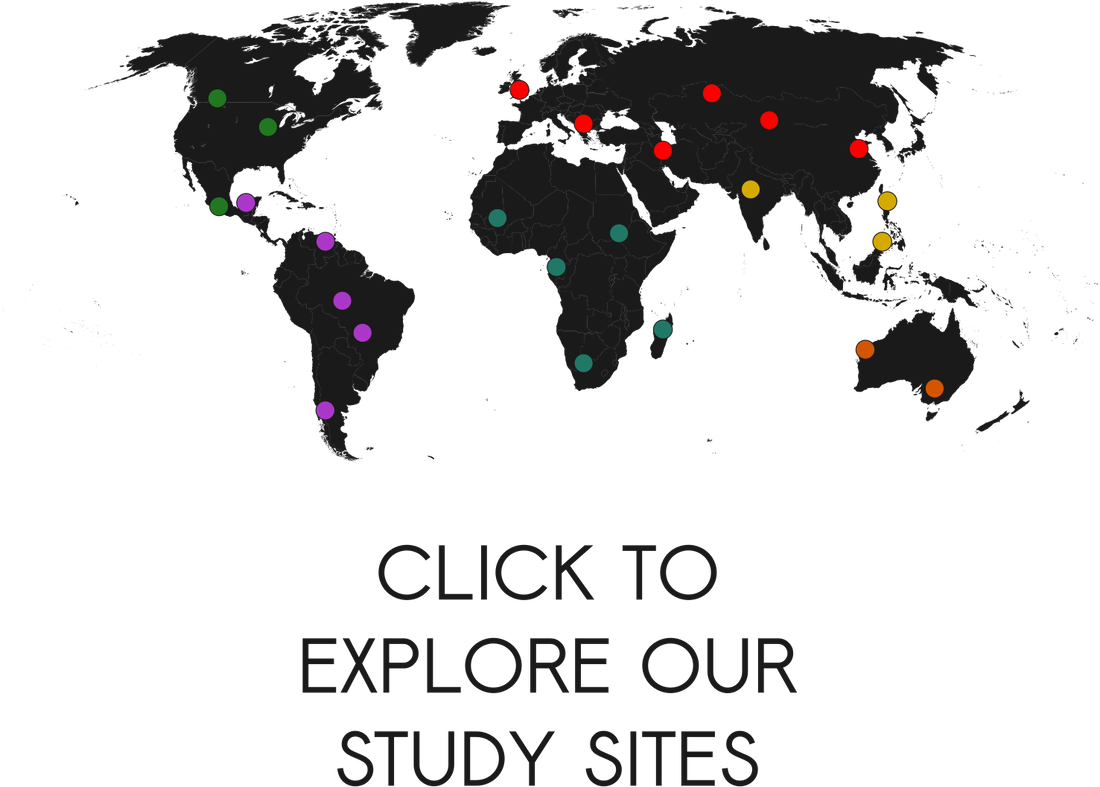
The set of some 100 sites are selected to represent a significant subsample of the existing insect diversity on Earth, covering different biogeographic regions around the globe on a coarse grid. Full or partial mitochondrial genomes (and possibly other markers) place each species on the deep-level phylogenetic tree, while the tree provides a phylogenetic fingerprint of each site.
How the data may be used – revealing biodiversity patterns
Mitogenome data from many local sites provide a unified image of global species and phylogenetic diversity. They can be used to analyse the structure of biodiversity both on temporal and spatial scales. Individual sites may be viewed as islands within the continental landscape that each hold a certain number of ‘endemic’ species. The more densely the grid of sites is sampled, the fewer species will be unique to any site, and this is even more true at the level of clades, which have wider distributions than single species.
A spatial and evolutionary continuum
Distribution data from site-based analysis and evolutionary data from the phylogenetic tree work together to provide the two major dimensions of biodiversity patterns, space and time. If lineages diverge through time while their ranges move gradually, the evolutionary depth of lineage separation is expected to mirror the spatial divergence. Thus, certain levels of the evolutionary hierarchy define the extent of biogeographic regions and the relative age of endemic communities. The SITE100 database can test these hypotheses and assess them for particular lineages and geographic regions, for a map of evolutionary divergence and spatial uniqueness of biological diversity.
Explore to learn more!
The set of some 100 sites are selected to represent a significant subsample of the existing insect diversity on Earth, covering different biogeographic regions around the globe on a coarse grid. Full or partial mitochondrial genomes (and possibly other markers) place each species on the deep-level phylogenetic tree, while the tree provides a phylogenetic fingerprint of each site.
How the data may be used – revealing biodiversity patterns
Mitogenome data from many local sites provide a unified image of global species and phylogenetic diversity. They can be used to analyse the structure of biodiversity both on temporal and spatial scales. Individual sites may be viewed as islands within the continental landscape that each hold a certain number of ‘endemic’ species. The more densely the grid of sites is sampled, the fewer species will be unique to any site, and this is even more true at the level of clades, which have wider distributions than single species.
A spatial and evolutionary continuum
Distribution data from site-based analysis and evolutionary data from the phylogenetic tree work together to provide the two major dimensions of biodiversity patterns, space and time. If lineages diverge through time while their ranges move gradually, the evolutionary depth of lineage separation is expected to mirror the spatial divergence. Thus, certain levels of the evolutionary hierarchy define the extent of biogeographic regions and the relative age of endemic communities. The SITE100 database can test these hypotheses and assess them for particular lineages and geographic regions, for a map of evolutionary divergence and spatial uniqueness of biological diversity.
Explore to learn more!
The SITE100 and SOIL100 projects are collaborations of researchers with complementary interests in arthropod surveys using molecular methods. Individual collaborators are listed under the “Study Sites” tab with the respective project description. The project has been started with funding from the Biodiversity Initiative of the Natural History Museum (2013-2015) to work out the methodology. It is currently supported by computing resources at the Chinese Academy of Sciences, Beijing, while several subproject have independent funding.